Our Products
Research, Tools, and Reports to Understand the Social Sector in the U.S.
Every month, we aggregate, classify, organize and update over 800 million units of knowledge gathered from filings with the U.S. Internal Revenue Service – IRS and other trusted sources of information.
We continuously curate interactive data visualizations and reports to inspire social impact funders, social entrepreneurs, innovative technology providers, governments, and nonprofits to solve our most pressing social challenges through community building, knowledge sharing, and collective impact.
By Topic
By Type
help
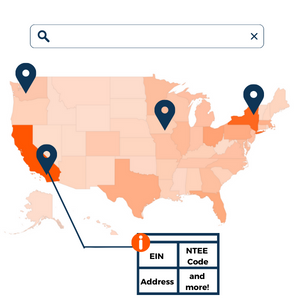
Online Interactive Tool
See what information is on file for your organization including NTEE Code, EIN, website, address, area of focus, alignment with the UN SDGs, and more. Request updates to any out of date information.

Online Interactive Tool
Our easy-to-use tool is designed specifically to support nonprofit executives with requesting an update to your organization’s National Taxonomy of Exempt Entities (NTEE) Code with the Internal Revenue Service (IRS).

Online Interactive Tool
Learn about the NTEE Code Classification System for US Nonprofits and determine the correct code for your organization to help with grants and donations.
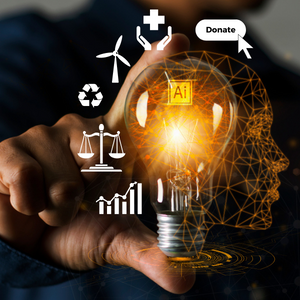
Downloadable Report
Explore the potential for harnessing the power of Artificial Intelligence (AI) tools like ChatGPT to support donors, nonprofits and other impact-driven stakeholders working on key issues like climate change.
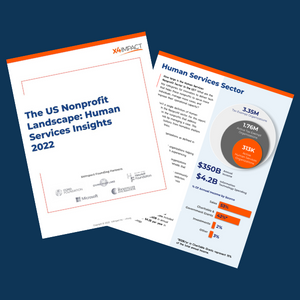
Downloadable Report
Insights on 300,000+ nonprofit organizations in the US that focus on Human Services.

Premium Report
Explore $850B+ flowing to 160K+ PreK-12 schools and supporting nonprofit organizations serving 53M students. With insights for Philanthropists, Impact Investors, Consulting Firms, and Technology Providers.
Online Interactive Tool
Explore by UN SDG the total addressable market for tech for good solutions in the US, including nonprofit software spending.
Online Interactive Tool
At-a-glance view of how each one of the 50 states in the US rank on key indicators related to the 17 UN SDGs.
Downloadable Infographic
Opportunity Landscape of the nonprofits and tech for good companies working on affordable & reliable housing in the US.
Downloadable Infographic
Service deserts are like food deserts, but show gaps for nonprofit service organizations.
Downloadable Infographic
Service deserts are like food deserts, but show gaps for nonprofit service organizations.
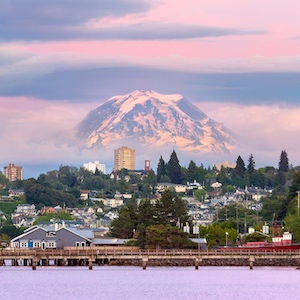
Premium Report
Explore $7.2B flowing to 3.7K active tax-exempt organizations in Pierce County, WA. With insights for Philanthropists, Impact Investors, Consulting Firms, Academia, and Technology Providers.
Downloadable Infographic
Landscape snapshot of nonprofits working on key issues in the US using a social justice approach.
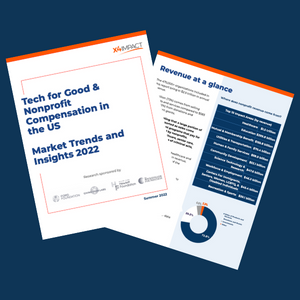
Downloadable Report
Explore actionable insights on how to remain competitive as you seek to acquire and retain talent.
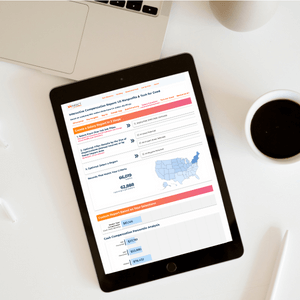
Online Interactive Tool
Create custom reports to inform your annual budget, board meeting, and people strategy, with this interactive report based on over 500,000 salaries.
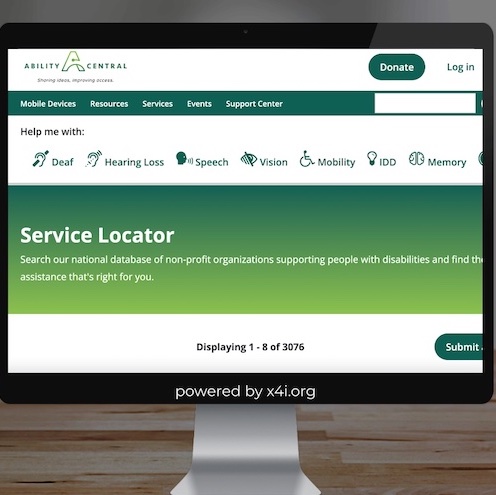
Case Study
Learn how the leading philanthropy for communications disabilities harnessed an GC Insights custom dataset to create a new online tool transforming information access for disability communities.
Premium Report
Our Geographic Landscape Series focuses on analyzing over 1.8M active tax-exempt organizations in the US to provide insights for Philanthropists, Impact Investors, Consulting Firms, Academia, and Technology Providers.
Premium Report
Our customizable Vertical Landscape Reports provide insights for Philanthropists, Impact Investors, Consulting Firms, Academia, and Technology Providers on tax-exempt organizations in the US working on a selected issue area.
Downloadable Infographic
An GC Insights Service Desert Map™ is a powerful visualization of the opportunity gaps between populations in need of services and the number of nonprofits servicing specific locations or the flow of social funding towards those populations.

Case Study
Learn how a grantmaking organization used a landscape analysis of 2,200 target nonprofits in Greater Boston and the visualization of areas with service gaps to inform long-range planning.

Online Interactive Report
Poverty-related indicators by state, including the percent of homeless individuals who are young adults and veterans.

Online Interactive Report
View hunger and malnutrition statistics, such as the percent of households receiving food stamps and the ratio of organizations to food insecure households.

Online Interactive Report
Understand the total size of the US healthcare system and accessibility of mental health and other services.

Online Interactive Report
The US education system, from public schools to higher education, including student-teacher ratios and the impact of student loan debt.

Online Interactive Report
Explore Gender equality trends such as the number of women in Congress, the gender pay gap, and related nonprofits.

Online Interactive Report
Check your state’s clean water and sanitation indicators, including violations of the Safe Drinking Water Act.

Online Interactive Report
Trends in clean energy generation and affordability by type of energy source.

Online Interactive Report
Minimum wage trendlines by state and analysis of the organizations that support economic growth.

Online Interactive Report
Broadband access, road conditions, State investment in R&D, and organizations focused on Infrastructure.

Online Interactive Report
Employment-related discrimination by state, income inequalities, and sector funding analysis.

Online Interactive Report
Public transport, carbon emissions, urban green spaces, museums, aquariums, and zoos by state

Online Interactive Report
Food waste, hazardous waste, recycling, and responsible production by state, and sector funding analysis.

Online Interactive Report
Climate Change, Carbon Emissions, Extreme Heat and the nonprofits working on these issues.

Online Interactive Report
Ocean pollution, overfishing, plastic pollution, and marine protected areas in the US.

Online Interactive Report
Biodiversity, endangered species act, deforestation, wildfire, ecosystem services, and land use.

Online Interactive Report
The criminal justice system, imprisonment, probation, parole, and incarceration, in the US.
Online Interactive Report
International Development, Research, Public Policy, and Partnerships to achieve the UN Goals in the US